Environmental Protection
Global Warming Mitigation
| Item | P | D | C | A |
|---|---|---|---|---|
| Targets for 2022 | Results in 2022 | Achievement | Targets for 2024 | |
| Global Warming Mitigation |
Medium- to Long-Term Targets for CO2 Emission Reduction (Scope 1+2)
|
|
★★ |
Medium- to Long-Term Targets for CO2 Emission Reduction (Scope 1+2)
|
| Strengthen management by implementing management system for chlorofluorocarbon |
|
★ | Strengthen management by implementing management system for chlorofluorocarbon |
Reducing CO2 Emissions by Reducing Energy Consumption
We have set medium- and long-term targets for the reduction of CO2 emissions from production activities (Scope 1+2) in the two steps of the PDCA table above. To achieve these targets at each business site, we have formulated an energy-saving roadmap and are steadily introducing equipment and technologies.
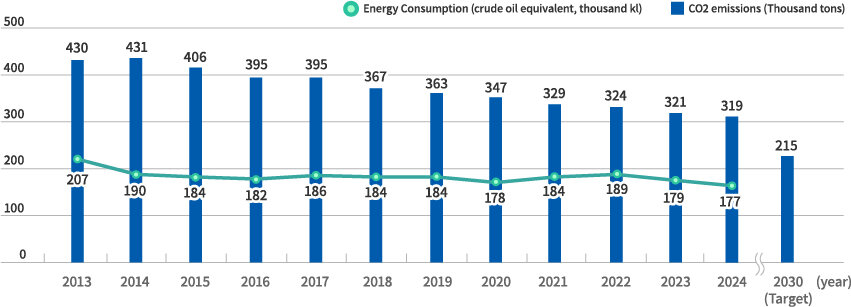
In 2023, the situation was difficult due to the unstable production plan caused by the Ukraine issue, which resulted in a decrease in energy consumption but worsened energy consumption per unit of production, and an increase in the CO2 emission factor of the electric power company.
We will continue to accurately calculate GHG emissions by identifying CO2 emission sources without omission. We are also promoting the optimal use of energy by introducing renewable energy in-house and through collaboration with local communities.
Prevention of CFC leakage
In accordance with the Fluorocarbons Emission Control Law, we monitor the amount of fluorocarbons leaked and take measures to prevent leakage.
In FY2022, Toagosei leaked 1,213 tons (CO2 equivalent) of fluorocarbons and reported the leakage to the government.
We are working to prevent CFC leakage through thorough equipment inspections and trouble prevention measures, introduction of systems, and systematic conversion to refrigerant equipment with low global warming potential (GWP).
Energy consumption and CO2 emissions of domestic manufacturing sites since 2013

*Scope of aggregation: Domestic manufacturing sites
Initiatives for a Recycling-Oriented Society
| item | P | D | C | A |
|---|---|---|---|---|
| Targets for 2023 | Results in 2023 | Achievement | Targets for 2024 | |
| Initiatives to Realize a Recycling Society |
|
|
★ | Final landfill disposal rate: 0.5% or less |
|
|
★★★ |
|
|
|
|
★★★ |
|
Reduction of final landfill disposal volume and waste recycling efforts
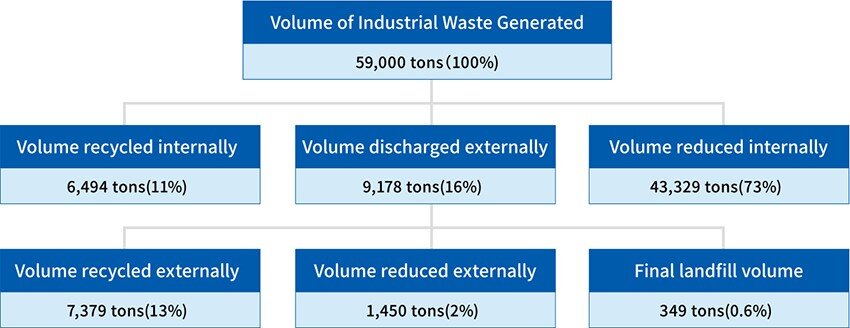
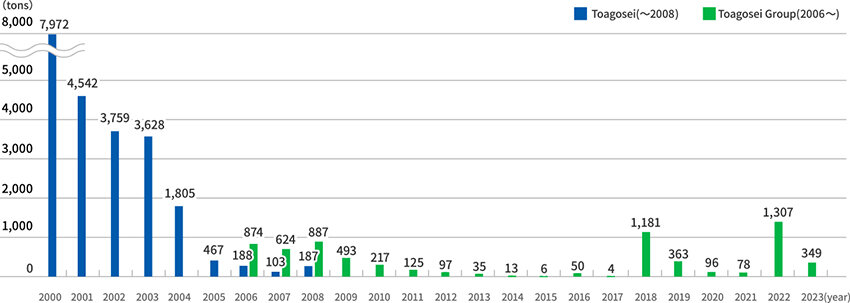
As a waste reduction target, we have been working to achieve a final landfill disposal rate of 0.5% or less. However, in 2023, the final landfill disposal rate was 0.6%, falling short of the target due to the generation of construction soil left over from building demolition. The final landfill disposal rate due to normal production activities was 0.1%.
We are also promoting efforts to increase the recycling rate at each business site, but as the concept of the circular economy spreads in society, the definition and priorities of recycling are changing, such as the Plastic Waste Recycling Law. We will continue our efforts while reviewing the process.
Industrial Waste Processing Flow

Final landfill disposal volume

Environmental Impact Reduction initiatives
| item | P | D | C | A |
|---|---|---|---|---|
| Targets for 2023 | Results in 2023 | Achievement | Targets for 2024 | |
| Environmental Impact Reduction initiatives |
|
|
★ |
|
|
|
★ |
|
Protection of Water Quality
The Group views water as a limited resource and strives to promote its efficient use. in 2023, the domestic Group's water usage was 51 million m3 and total water discharge was 39 million m3, a decrease from the previous year. The pH of specific wastewater exceeded the legal limit, and we are strengthening our wastewater discharge facilities and monitoring system. At plants adjacent to closed system waters (Tokyo Bay, Ise Bay, Seto Inland Sea), automatic measuring equipment for total nitrogen and total phosphorus has been installed to manage total volume control. Even at our overseas manufacturing sites, the use of water resources is managed in compliance with the emission regulations of each country.
Protection of Air Quality
To comply with government emission standards and regulation values in agreements with local communities for sulfur oxides (SOx), nitrogen oxides (NOx), and dust in exhaust gas, we set our own voluntary control values and thoroughly manage exhaust gas emissions. In addition, the respective overseas production sites control their exhaust in accordance with applicable regulations in their jurisdictions.
Chemical Substance Emissions Reduction
In accordance with the "Act on the Promotion of Chemical Substance Emission Control" (commonly known as the PRTR Law), each business site has been properly notified.
In 2023, we have been working to understand the additionally designated substances as well as to reduce the use of existing substances.
In the future, we will set targets not only for PRTR substances but also for all other chemical substances, including 26 substances subject to voluntary control by the Japan Chemical Industry Association (JCIA).
Emissions of Principal Substances Subject to PRTR (t)
| Major emissions | 2022 | 2023 |
|---|---|---|
| Chloromethane (methyl chloride) | 26 | 32 |
| Methyl acrylate | 6.4 | 5.0 |
| Chloroethylene (vinyl chloride) | 3.5 | 3.0 |
| n-Hexane | 1.1 | 0.4 |
Environmental accounting
In 2000, we introduced environmental accounting to grasp the costs and effects of environmental activities and to use them as a basis for making decisions on more efficient environmental conservation activities.
Scope of calculations
Companies and establishments listed in the chart below (under "Business Activities and Environmental Impacts")
Period covered
January 1 to December 31, 2023
Calculation method
1 - The calculation was made according to our "Calculation Rules" prepared in reference to the Ministry of the Environment's Environmental Accounting Guidelines (2005 version).
2 - Compound costs, including costs other than for environmental preservation purposes, were also included in the environmental costs by dividing them proportionally according to the degree of impact on the environment.
3 - The amount of investment is the actual investment in facilities, and the amount of cost is the actual maintenance and management cost of facilities, personnel cost, etc.
4 - For items for which effects can be clearly calculated, we calculated them in monetary units and physical quantity units. However, effects that are difficult to quantify, such as risk avoidance and deemed effects, are not included.
However, effects that are difficult to quantify, such as risk avoidance and deemed effects, are not included.
Environmental Investment and Expenses by Cost Category
| Types of environmetal conservation costs (Content of major initiatives) | Investment(Millions of yen) | Cost(Millions of yen) | |
|---|---|---|---|
| Cost within business area | 2,221 | 7,045 | |
| Breakdown | 1 Pollution prevention costs (costs to prevent atmospheric and water pollution) | 2,053 | 5,661 |
| 2 Environmetal preservation costs (costs to prevent global warming, promote energy-saving, prevent destruction of the ozone layer) | 131 | 966 | |
| 3 Material recycling costs (costs to use materials ef ciently and for disposal and treatment of industrial waste) | 37 | 419 | |
| ② Upstream/downstream costs (costs incurred in downstream/upstream from manufacturing and service activities: green procurement, etc.) | 11 | 34 | |
| ③ Management activity costs (costs to maintain and operate environmental management system, monitor and measure envirnmental impact, and offer environmental education) | 105 | 530 | |
| ④ R&D costs (costs to research and develop products and other items that contribute to environmental protection and reduce environmental impact during manufacturing) | 312 | 1,132 | |
| ⑤ Social activity costs (costs of nature conservation and environmental improvements such as greenication, donations to and support for environmental protection organizations, and activities related to local residents) | 0 | 237 | |
| ⑥ Environmental damage costs (costs to recover nature and for compensations related to environmental conservation) | 0 | 17 | |
| ⑦ Other costs related to environmtal conservation | 2 | 138 | |
| Total | 2,650 | 9,133 | |
Business Activities and Environmental Impacts
| Scope | Calculation period | |||
|---|---|---|---|---|
| Toagosei Group | Toagosei | Plants | Nagoya Plant, Yokohama Plant, Takaoka Plant, Tokushima Plant,Sakaide Plant, Oita Plant, Kawasaki Plant, Hirono Plant | January 1 to December 31, 2023 |
| Research centers | General Center of Research and Development (Aichi Prefecture), Institute for Advanced Sciences (Ibaraki Prefecture) | |||
| Group companies | Aronkasei | Kanto Plant (Ibaraki Prefecture), Nagoya Plant, Monozukuri Center (Aichi Prefecture), Shiga Plant, Onomichi Plant | ||
INPUT
Energy Consumption
| 2022 | 2023 | |
|---|---|---|
| Energy Consumption (crude oil equivalent, thousand kl) | 189 | 179 |
Water consumption
| 2022 | 2023 | |
|---|---|---|
| Water resources (million m3) | 56 | 51 |
OUTPUT
Business Activities
| 2022 | 2023 | |
|---|---|---|
| Production volume (thousand tons) | 1,181 | 1,090 |
Industrial Waste
| 2022 | 2023 | |
|---|---|---|
| Volume of industrial waste generated (tons) | 65,956 | 59,000 |
| Volume reduced internally (tons) | 45,658 | 43,329 |
| Volume discharged externally (tons) | 13,050 | 9,178 |
| Final landfill volume (tons) | 1,307 | 349 |
| Final landfill rate (%) | 2.0 | 0.59 |
Environmental Impacts on Water Resources
| 2022 | 2023 | |
|---|---|---|
| Total effluent volume (million m3) | 42 | 39 |
| COD (tons) | 66 | 57 |
| Total nitrogen (tons) | 24 | 22 |
| Total phosphorus (tons) | 2.0 | 1.9 |
| Substances subject to PRTR (tons) | 2 | 2 |
Environmental Impacts on Atmosphere
| 2022 | 2023 | |
|---|---|---|
| CO2(CO2equivalent, thousand tons) | 353 | 330 |
| SOx (tons) | 40 | 46 |
| NOx (tons) | 71 | 761 |
| Soot and dust (tons) | 5 | 4 |
| Substances subject to PRTR (tons) | 32 | 44 |

